


It's not okay, but we're all gonna be alright
All LettersI hope this note finds you well. Spring is in the air, and so is the pollen!
Lately, I have been playing Jelly Roll's "I Am Not Okay" on repeat. I first heard the song while he was mentoring on American Idol (yes, it is a guilty pleasure). While Jelly Roll wrote the song about his journey, the song has spoken to me the last few weeks about what is happening in the markets. The line in the chorus, "It's not okay, But we're all gonna be alright" has really resonated with me.
Recap of Q1: Volatility
With near-daily news driving markets, there is almost too much news and too many events to succinctly recap here. The Trump administration came out of the gates with guns blazing on numerous fronts. The biggest driver of uncertainty has been tariffs. The markets dislike uncertainty, so I fear we will not have a market bottom until we have some clarity on tariffs.
Markets initially rose in 2025, hitting a new high on February 18. In early April, the market, as measured by the S&P 500, briefly dipped 20% below that all-time high during intraday trading before staging a strong rebound. Meanwhile, the tech-heavy Nasdaq has been lingering just below the 20% mark from its recent peak.

Charts of the Month
There are a lot of great charts out there right now, and I’m going to lean on them to help tell the story of where we are.
The good news? We’re not currently in a recession - at least not according to the data. (A little advisor confession here: that’s technically true based on the definition of a recession being two consecutive quarters of negative GDP growth.)
The not-so-good news is that there is growing sentiment that we might be heading in that direction. I say “might” because, as we’ve seen time and again, things can change quickly—both for better or worse.
Federal Reservice GDP Models
In the first chart, we're looking at data from the Federal Reserve that shows expected GDP growth based on their economic models.
You'll notice a sharp drop in the near-term growth forecast in February. For context, the inauguration was on January 20, and 'Liberation Day' was on April 2.

Consumer Inflation Expectations
In the second chart, we’re looking at consumer expectations around inflation. There is a noticeable spike in early 2025.
That’s not surprising, given the steady drumbeat of headlines about tariffs and rising prices. The key takeaway here is that inflation expectations matter. When people believe prices will keep rising, they often act in ways (like demanding higher wages or making purchases sooner) that help drive inflation higher. In other words, expectations can become a self-fulfilling prophecy.

Timing of Market Corrections and Recoveries
The following chart looks at the length and depth of market corrections. Quick refresher: a correction is defined as a market decline of 10% to just under 20%. (Anything beyond a 20% drop, called a bear market, isn’t shown here.)
This chart shows that, on average, these corrections drop about 14% - which is right around where the market is currently trading. What’s interesting is the range in how long it takes to find a bottom. In some cases, it has taken over 200 days (more than six months); in others, it has taken only days or weeks. Notably, in nearly every case, the recovery has been quicker than the drop.
Here is the key takeaway: So far, what we’re seeing has been a fairly typical correction.

Historical Returns – Long time horizons mean more predictability of returns
On the left side, you’ll see 1-year returns - essentially short-term market performance. What jumps out immediately is the wide range of outcomes. Some years show significant gains (up as much as 60%), while others show substantial losses (down as much as 40%). That’s the nature of short-term investing: it can be a rollercoaster.
As you move to the right side of the chart, the time frames get longer - and the investment outcomes become more stable and predictable. The longer your investment horizon, the smaller the swings and the more consistently positive the returns tend to be..
Take away: if your investment horizon is long enough, your expected return is generally positive. In other words, STAY THE COURSE!

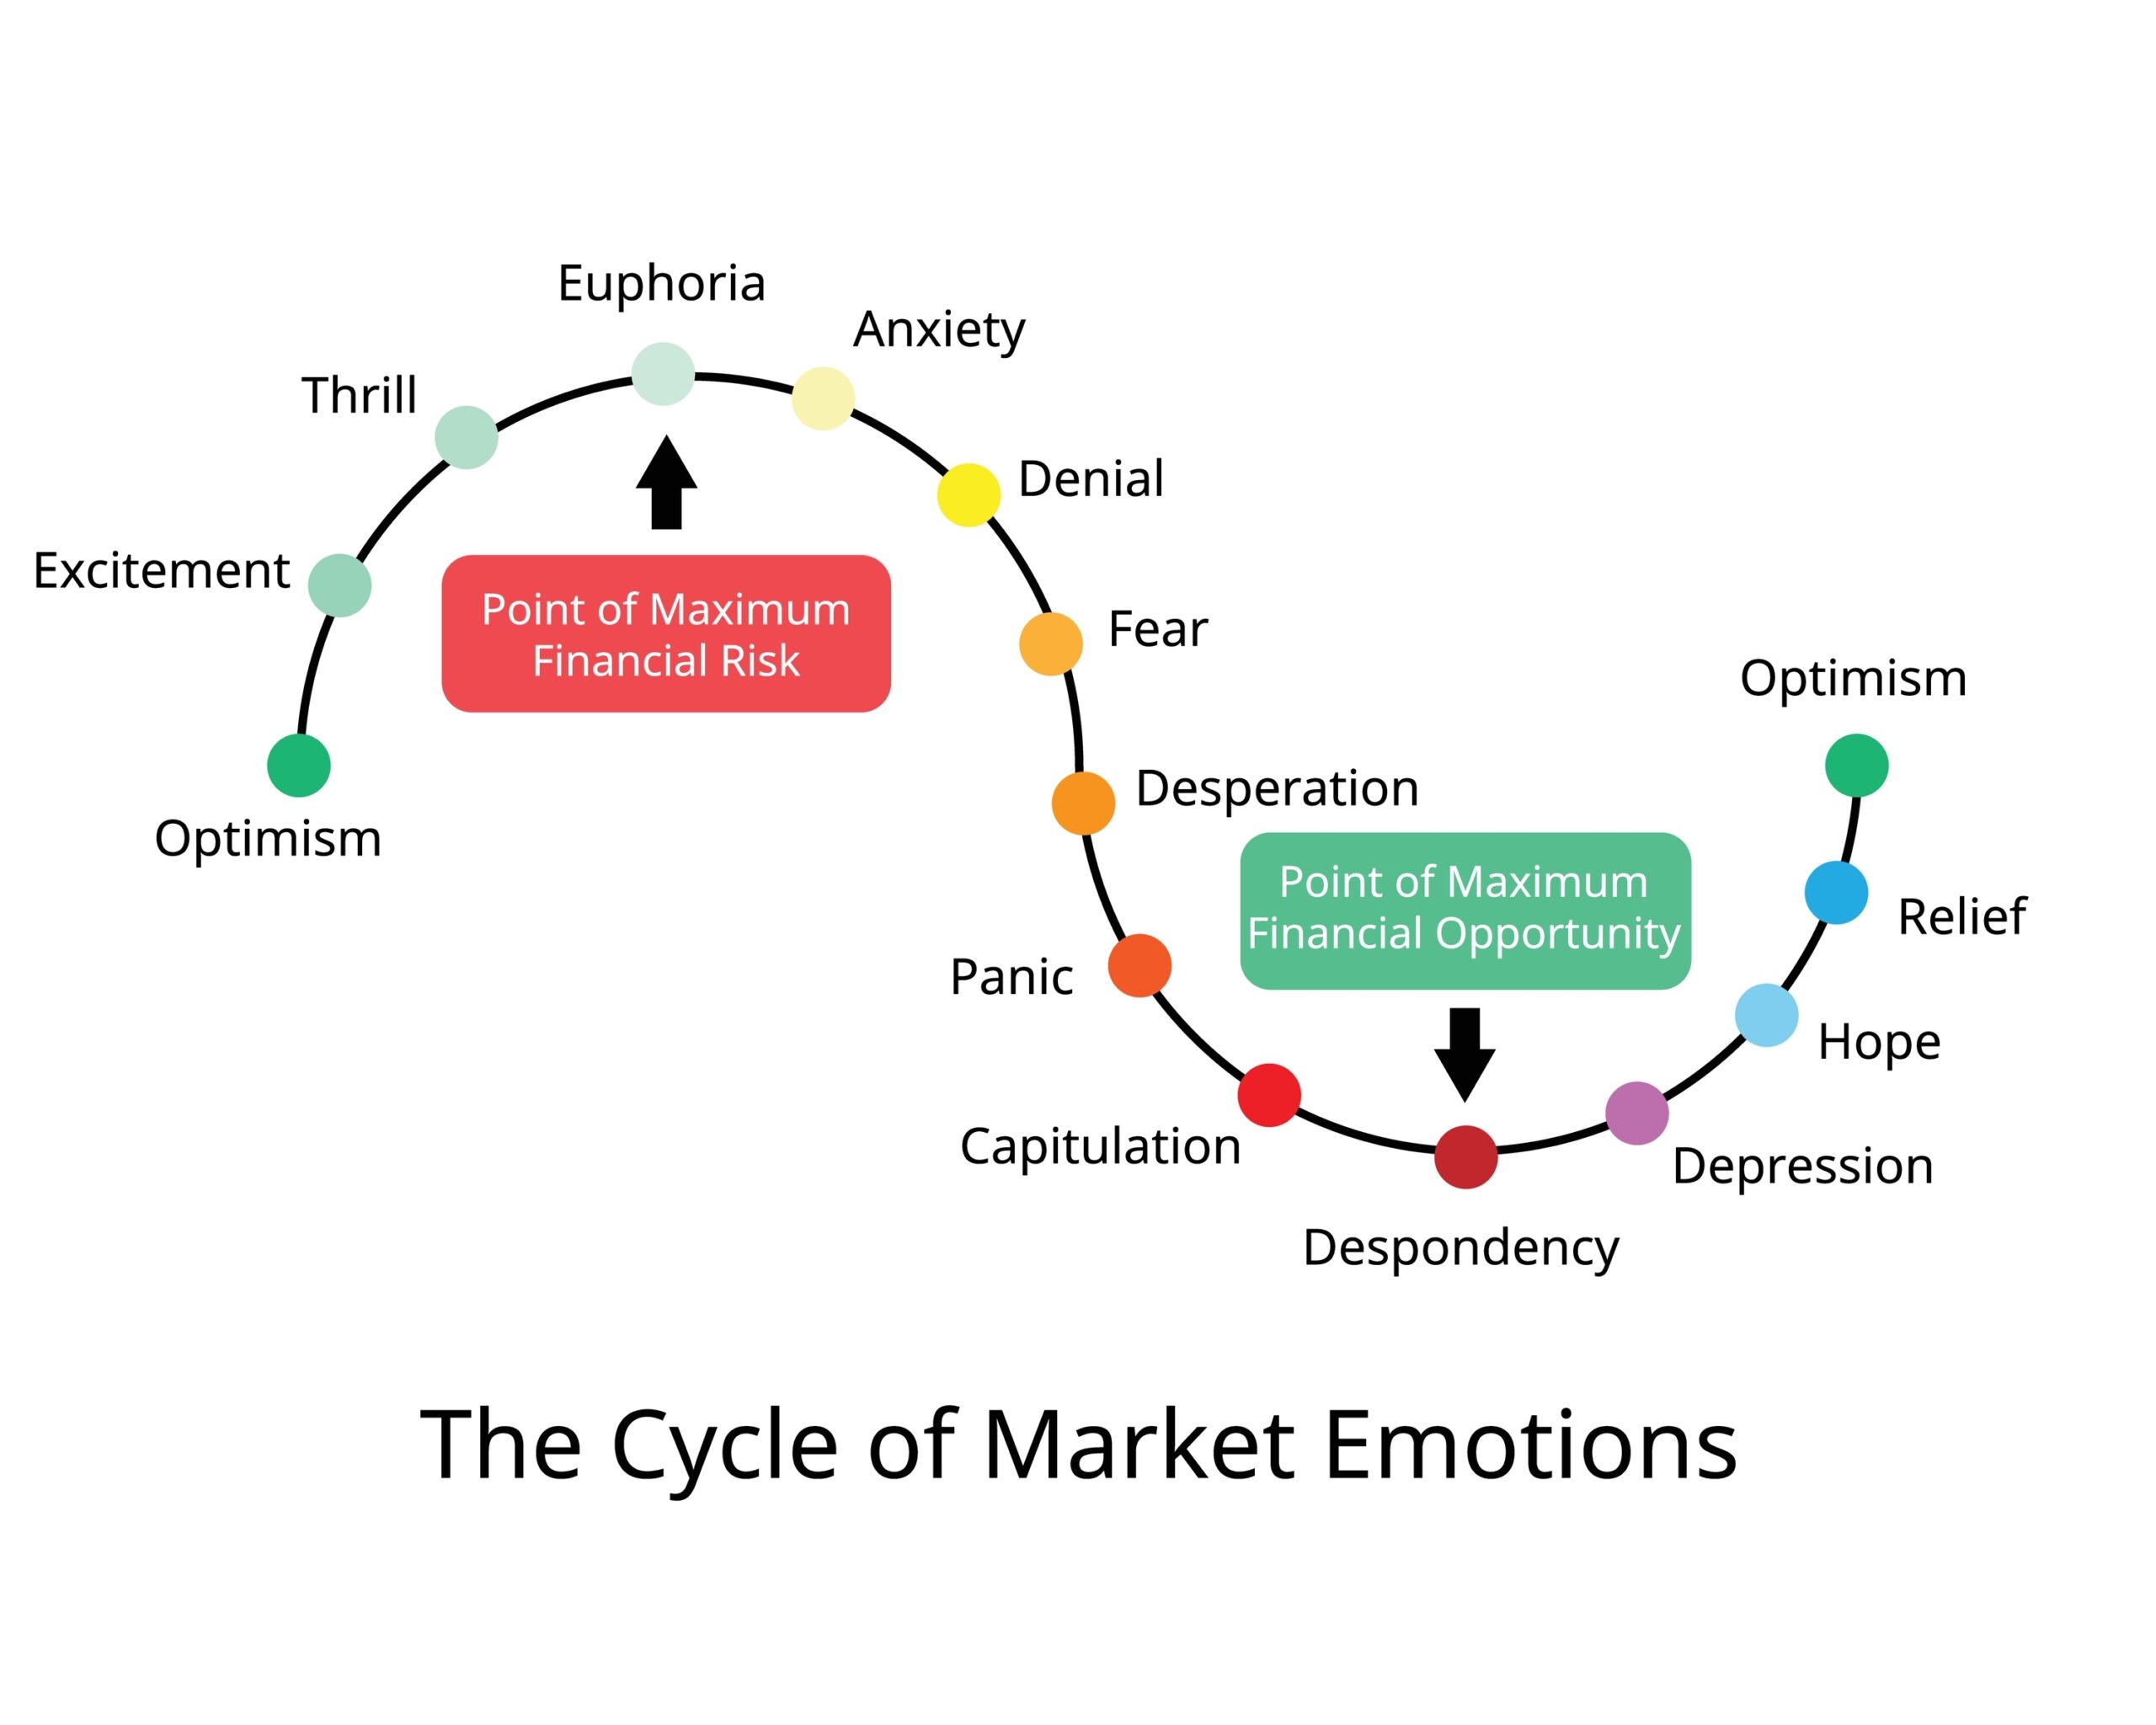
Cycle of Emotions in Market Ups and Downs
The following graph highlights the connection between markets and our emotions.
It illustrates the emotional cycle investors often experience as markets rise and fall, ranging from optimism and excitement to fear and despair. Recognizing where you are emotionally on this curve can be a powerful tool. It helps you stay grounded and focused on the long term rather than getting swept up in short-term reactions.
I find it helpful to revisit this chart occasionally as a kind of emotional check-in. It’s a reminder that while market swings are normal, keeping our emotions in check helps us stay disciplined.
Take away: know where you are on this graph and check in with me if in the red zone.
The Rise of ChatGPT
ChatGPT's meteoric rise has redefined digital adoption, achieving unprecedented growth since its 2022 debut. In terms of technology adoption, it stands among the fastest ever - scaling from 1 million to 100 million users in just days. By early 2025, the platform boasts over 400 million weekly active users, a staggering leap from 300 million just two months prior, solidifying its place as one of the fastest-growing applications in history. With ambitions to reach 1 billion users, OpenAI is investing heavily in infrastructure and innovation, positioning ChatGPT not just as a tool, but as a transformative force in the AI-driven era.
Editor’s note: this paragraph was generated by ChatGPT.

Final Thoughts
It may not feel “okay” right now. Volatility and uncertainty are never comfortable. But with a long-term plan and a disciplined, diversified approach, we’re all gonna be alright.
We have discussed your financial goals with you, enabling us to design a roadmap to achieve them. This roadmap is unique to you, and keeping our eye on the long term can help remove emotional biases that can sometimes infiltrate the decision-making process during times of uncertainty.
A diversified portfolio cannot completely shelter you from market pullback. Still, it helps reduce volatility while tapping into the wealth-creating potential that stocks have offered over the long term.
I trust you have found this review to be informative. If you have any inquiries or wish to discuss any other matters, please don’t hesitate to contact me or any team member.
Thank you for choosing us as your financial advisor. We are honored and humbled by your trust.
Warm regards,
Chris Duke
April 23, 2025
DISCLOSURES
This is being provided for informational purposes only and should not be construed as a recommendation to buy or sell any specific securities. Past performance is no guarantee of future results, and all investing involves risk. Index returns shown are not reflective of actual performance nor reflect fees and expenses applicable to investing. One cannot invest directly in an index. The views expressed are those of Chris Duke and do not necessarily reflect the views of Mutual Advisors, LLC, or any of its affiliates
Investment advisory services are offered through Mutual Advisors, LLC, DBA Context Wealth, an SEC-registered investment adviser.